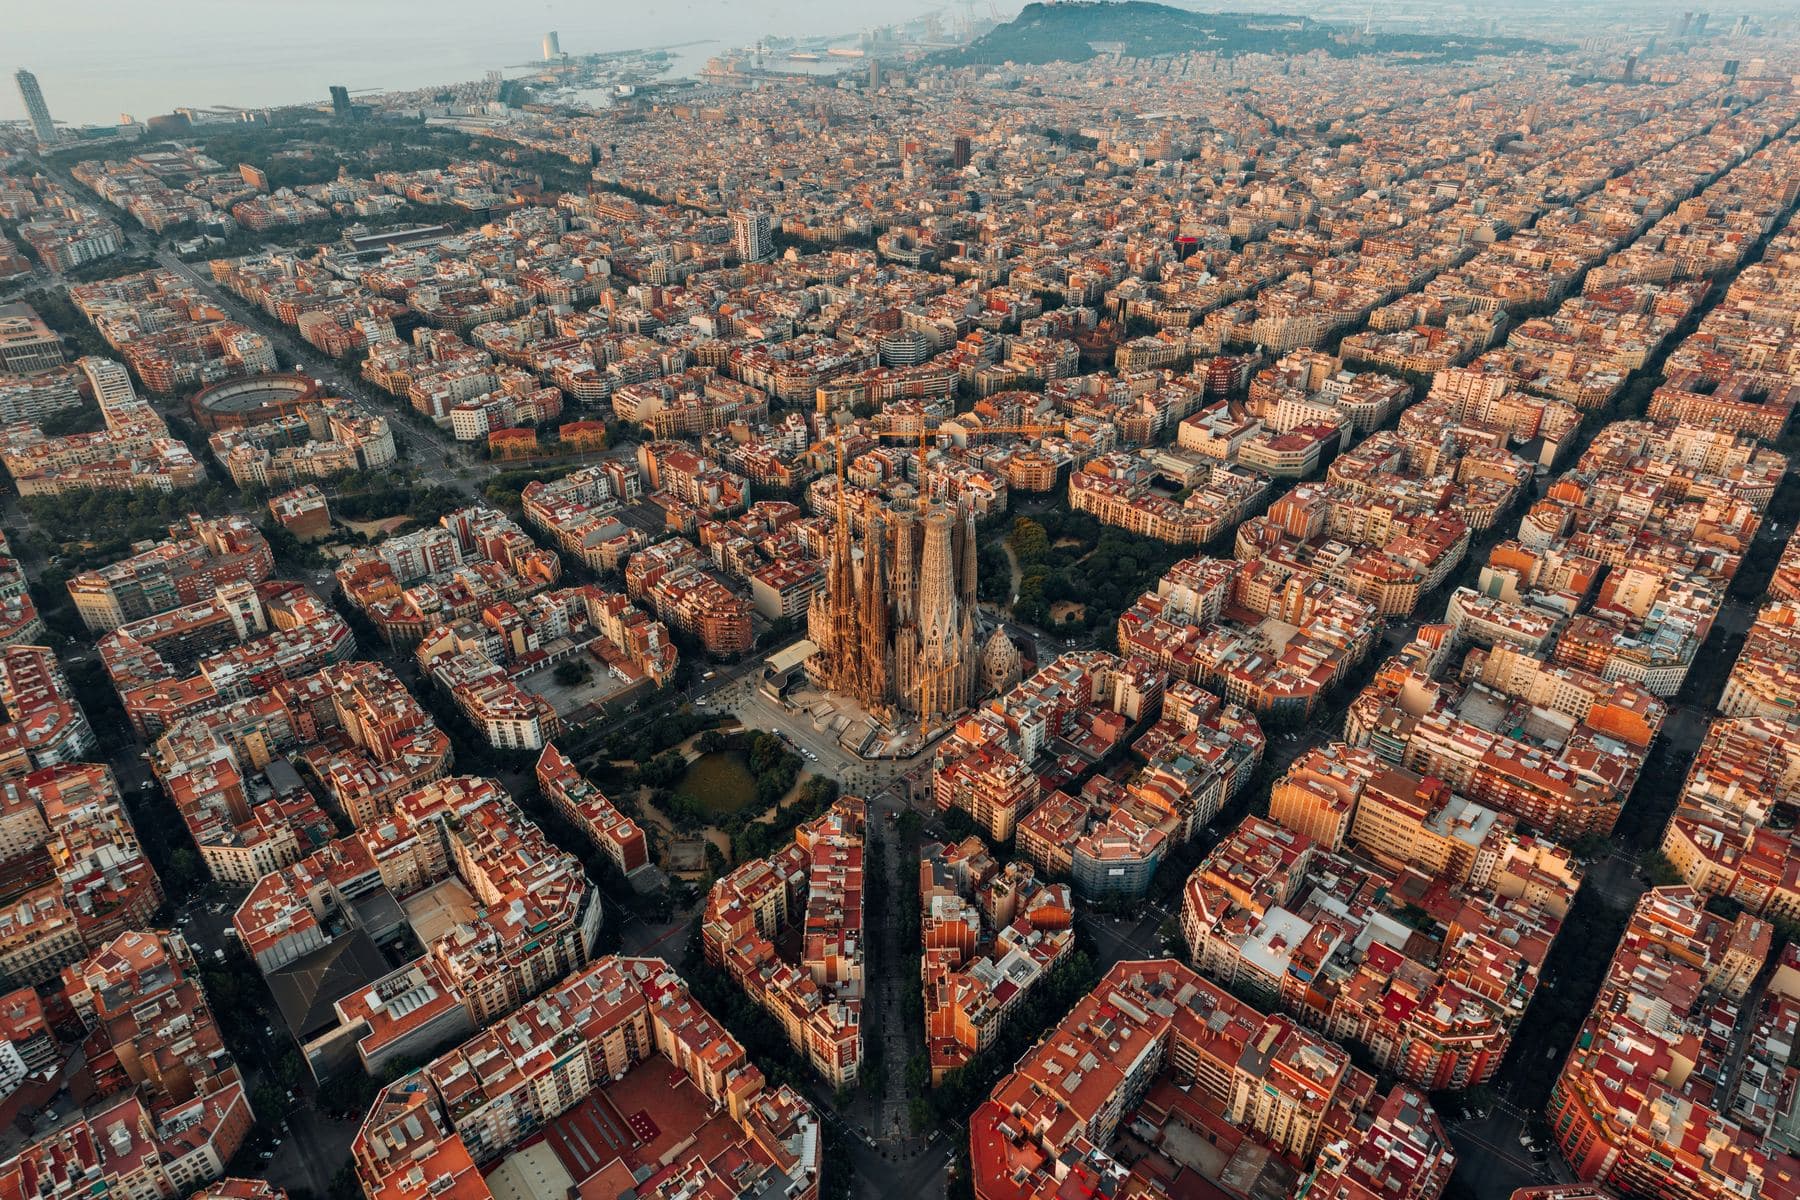
The City Government of Barcelona wanted to improve an old neighborhood and maintain their position as one of Europe's leading innovation economies. The city had existing assets: research institutions, a strong startup scene, and an established district anchored by the 22@ district, but lacked a rigorous, data-driven account of where its innovation network was strong, where it had gaps, and what interventions would create the most leverage.
This case study documents the question: How to create an innovation-focused economy? This analytical framework was developed by Aretian and deployed across 27 projects for city, university, and real estate clients who wanted to develop their economy locally to have an impact globally. The Aretian method was the first to create a playbook to develop innovation districts worldwide to map knowledge networks, identify structural gaps, and make evidence-based recommendations for where to invest.
As co-founder and managing partner, I led the strategic thinking behind this work: designing the connected analytical workflow, building the initial framework, and writing the code for the innovation analysis that became the foundation of the company.
Section 01
How to Create an Innovation-Focused Economy?
Aretian built a framework to help cities develop innovation-driven economies.
Innovation doesn't happen on its own. It takes the right mix of industries, companies, institutions, and physical space before new ideas can take hold and grow. Aretian built databases and analysis methods to identify those ingredients and design site-specific innovation ecosystems, spanning economic, social, demographic, educational, and geographic factors.
I built much of this framework at Aretian, and Barcelona is the project where it came together most completely. I designed how the separate analyses connect into a single workflow and wrote the code for the innovation analysis at its core, which became the foundation for the rest of the company's work.
The method works in three steps.
First, three analyses gather the information:
- Economic & Innovation Analysis: measures how innovative and competitive the economy is, based on the city's unique industry makeup and benchmarked against top-performing innovation districts worldwide.
- Research Analysis: maps published and patented work from universities to identify technology-transfer opportunities and feed new ventures through commercialization programs.
- Geographic Analysis: establishes design criteria for layout and organization that make the district an attractive place to work.
Second, those results define the innovation pipeline: a step-by-step process for turning new ideas into impactful companies. Each step specifies the researchers, startups, technology-transfer centers, mature companies, and site-design requirements the district needs to include, forming the programmatic brief for the project.
Third, we translate the brief into a design proposal tailored to the site: creating the spaces each industry, company, transfer center, amenity, and transit connection requires, and integrating the district into the existing city fabric.
The full process is shown in the Aretian Analytics Engine diagram.
Section 02
Project Overview
From industrial neighborhood to innovation district, the site context and client brief.
The City of Barcelona hired Aretian to develop a new innovation district on the North Eastern side of town. The goal was to replace an existing industrial and warehouse neighborhood with a new development to host the most advanced businesses and industries to grow Barcelona's economic and innovation ecosystem.
While Barcelona has one of the most diverse product and innovative ecosystems in Europe, it was also running out of modern office and lab space to stay competitive. The new space would provide the infrastructure and environment to attract fast growing companies and provide jobs for its residents.
Site Comparison: Before and After
The Analytical Framework
Aretian built the client a custom database which describes all critical metrics to help design the new development. This new database allowed us to evaluate each business's innovation output and competitive position, then design the new campus based on the model's recommendations.
Section 03
Economic Complexity & Innovation Analysis
Mapping Barcelona's industrial complexity and identifying the most promising new sectors.
Industry Analysis
The goal is to identify how complex the products your nation and cities export are. Products that are exported bring in a surplus of capital, and therefore grow the economy. Complex products are also correlated with greater economic growth because they typically have competitive businesses fighting for market share, integrated supply chains, and fair business practices supported by institutions. Examples of complex products include semiconductors and automobiles.
Nations that export simple products, such as agriculture and mining, tend to grow more slowly and develop less diversified institutions than those built on complex manufactured goods.
Economic complexity measures how sophisticated and diversified a country or city's productive knowledge is. Economies that export complex products (precision instruments, semiconductors, advanced manufacturing) tend to grow faster and build more resilient institutions than those dependent on commodities or simple goods. The theory, developed at Harvard's Growth Lab, holds that the best predictor of what an economy can become is what it already knows how to do. New industries that are close neighbors of existing ones are far easier to develop than industries with no local knowledge base. Atlas of Economic Complexity
Product Space of Barcelona
The Product Space of Barcelona shows a highly activated network of complex industries. Each colored node in the network graph represents one or more businesses in the city, and the links between them show closely related industries. Grey nodes are not present in Barcelona's economy, and therefore present an opportunity to be incorporated. In addition, each node has a measure of complexity: the more complex a product is, the greater the long-term economic growth will be.
Product Space Network: Barcelona
The implication for Barcelona is that the closer a new industry is to your current product space, the easier it will be to incorporate into your existing economy. Even though Barcelona has a highly diversified product space, the goal is to identify the closest, unactivated nodes that also represent highly complex products. If the city can successfully develop these new industries, it will have the greatest possible chances to grow its economy.
We complete this process by running a Smart Specialization Analysis. The horizontal axis shows how close unactivated nodes are, and on the vertical axis, how complex they are. Industries that fall into the top right hand corner are the target industries: they are close to your existing economy and highly complex. Therefore the group of industries they represent are most correlated with economic growth.
Smart Specialization Strategy
The analysis produced a ranked shortlist of target industries for the new district. From there, we could filter down the best options for a community and design a new campus that concentrates innovation in a centralized district, with a shared identity, brand, and community.
Business Composition
Analysis of the product space allowed us to understand the macro relationships between industries. At a smaller scale it is important to be able to understand how innovative each business is within its industry. This allows us to measure how advanced the business community is and how it connects to the rest of the innovation economy.
Innovation Tags
Aretian created an industry classification system to assign each business to its innovation category:
- Research & Academia: helps to create new startups through university research, hospitals, and public labs.
- Design & Engineering: supports the development of startups into mature companies through technology transfer and product development.
- Production & Manufacturing: helps produce the goods that are exported to remote markets at scale.
The tags allow us to see what percentage of the economy contributes to which phase of the innovation pipeline. Mapping the distribution across a city reveals where the pipeline is strong and where it breaks down.
Innovation Metrics
Based on the size and profitability of companies, it is possible to weigh each business in the product space to see how innovative it is according to three new variables: innovation intensity, performance, and impact, which describe how each business contributes to the levels of innovation in the economy.
- Innovation Intensity: describes the percentage of employees working on knowledge-intensive activities, broken down by each of the three innovation phases: research, technology transfer, and production.
- Innovation Performance: describes the business revenue per building group, generated by measurable innovations: new patents, new products, new services, new processes, R&D, and scientific papers.
- Innovation Impact: describes innovation employment per resident for each building group, as a proxy for availability of knowledge-intensive employment opportunities within the community.
Innovation Variables: Barcelona
Innovation Geography: Barcelona Metro Region
Barcelona has a strong distribution of highly innovative businesses throughout the city, but lacks clear business districts that cluster innovative companies. The city also lacks technology transfer centers (dedicated organizations and spaces that support researchers through the commercialization process) to connect universities and industries. There is a shortage of dedicated spaces to support this effort. This presents an opportunity to design a new campus dedicated to connecting the city's most active researchers and entrepreneurs.
These metrics help establish the benchmarks for how large the new innovation district needs to be to affect the broader economy. If a new district does not reach roughly 20,000 people working in innovative roles, then the local economy will not have enough employees to reach critical mass.
Section 04
Academic & University Research Analysis
Mapping Barcelona's research landscape and identifying technology transfer opportunities.
Researchers
The researcher database records what academics produce in their university labs: papers, patents, and publications, visualized as network graphs showing how individual contributors and department groups collaborate. Each output is tagged by domain and linked to startup and industry databases through crosswalk tables. For each university around Barcelona, we mapped every researcher's total output across six categories: school, department, publications, first-author papers, co-authored papers, and patents. The six-category breakdown showed which departments were the most productive and surfaced a specific list of individuals who could anchor the new district's research programs.
Researcher Network: Institut Germans Trias i Pujol
The individual-level graphs identified the most connected and productive researchers at each institution, producing a specific list of individuals who could anchor technology transfer programs or serve as founding advisors to new ventures in the district.
Departments
When we aggregate the research data to the department level, the noise of individual graphs disappears and larger trends for dominant research fields emerge. This lets us see what departments are the most productive and which research groups tend to collaborate with one another.
Department-Level Research Network: BarcelonaTech
The department-level analysis produced a ranked list of research fields by institution, identifying the specific academic departments strong enough to anchor the innovation cluster.
Universities
By comparing all of the city's universities, it's possible to clearly see what fields they are dominant in. While the academic research is very strong in Europe, universities lack technology transfer programs and struggle to commercialize innovative work.
To bridge the gap, we matched the most promising research fields to local startups and mature industries, creating the connections necessary to develop the startup and technology transfer programs that support the innovation economy.
Knowledge Networks Across Six of Eight Research Institutions
Barcelona's research institutions collectively produce world-class output in biotech, engineering, and materials science, directly aligned with the district's target clusters. But the lack of technology transfer programs means this knowledge is not reaching industry at scale. The district's program needed to include dedicated transfer centers, accelerator spaces, and structured industry-university partnerships to bridge this gap.
| Institution | Main Research Fields |
|---|---|
| BarcelonaTech: 2,045 Researchers | UrbanTech, Civil & Environmental Engineering, Mathematics, Physics, Electronic Engineering |
| University of Barcelona: 2,938 Researchers | Medicine, History, Biology, Genetics, Clinical Research |
| UPF: 816 Researchers | Life Sciences, Law, Economics, Information Technologies |
| UOC: 387 Researchers | Computer Science, Internet, eHealth, Creative Industries, Digital Design |
| Elisava: 35 Researchers | Product Design, Architecture & Urban Planning, Materials Science |
| UVic: 486 Researchers | Biosciences, Medicine, Communications, Engineering, Agri-Food, Nutrition |
| UAB: 2,317 Researchers | Government, Public Policy & Sociology, Neuroscience, Environmental Studies, Food Science, Humanities |
| IGTP / Can Ruti: 697 Researchers | Genetics, Oncology, AIDS Research, Leukemia, Clinical Trials |
Section 05
Urban Form & Geographic Analysis
Understanding Barcelona's urban form, connectivity, and accessibility to guide district design.
Aretian's research found that specific street layout patterns, building density thresholds, and high concentrations of civic and public amenities contribute to the success of innovation districts. Geospatial statistics of urban forms such as betweenness (how often a street acts as a shortcut between other places), street length, building orientation, and block size we correlated with neighborhoods that had highly productive businesses. By measuring the entire city, it's possible to see where design improvements would help better connect separated neighborhoods to provide greater economic opportunities.
I completed the code and the analysis for this urban form work, from the geospatial metrics through to the connectivity and accessibility maps that shaped the district's design.
Morphology & Topology
Urban morphology describes the physical shape of a city: the geometry of its streets, blocks, and buildings. Topology, how each element connects to one another, treats the city as a network of relationships rather than just a map of shapes. Together they determine how easy it is to move through a neighborhood and how many different routes exist between any two points.
Entropy measures the degree of disorder in a street network; higher entropy indicates more varied spatial arrangements that support multiple movement patterns. Fractality, how well a layout stays connected at every scale, from the block to the city, captures whether a layout stays well-connected at every scale simultaneously. A highly fractal urban fabric supports walking, mixed uses, and dense economic activity, due to its highly connected street network. This connection provides residents with the greatest opportunity to access amenities.
Fractality Map: Barcelona Neighborhoods
The fractality analysis confirmed that the project site's existing street and block pattern is among the least connected in the city, a consequence of its industrial layout designed for logistics rather than human movement. The building tessellation also scores poorly: existing parcels are too small, cramped spaces unable to house modern business and manufacturing operations. A redesigned block structure with shorter streets, smaller blocks, and more intersections will bring the site's fractality score in line with Barcelona's highest-performing mixed-use neighborhoods.
Accessibility
The site lacks amenities because it is a warehouse district. The new design added restaurants, shops, and public space to connect the active neighborhoods on either side of the site. Accessibility metrics, such as Reach and Gravity, describe how many nearby amenities are accessible within a given walk distance, and show how well residents and workers can reach services, shops, and public transit.
Building Tessellation: Project Site
Regional Accessibility: Project Site in Context
The measurements of urban form highlight where improvements can be made to better connect the city and develop missing features such as amenities, business districts, and housing. The site for the innovation district is well-positioned between two commercial centers, but its internal structure performs poorly. Redesigning the parcel structure and introducing fine-grained streets and new store fronts would dramatically improve local accessibility while preserving its strong regional connections. These findings directly shaped the street network and public space strategy in the district design.
Section 06
Innovation Pipeline Design
How the combined economic, research, and geographic analyses translate into a technical organization for the district.
The analysis of industries, companies, people, institutions, and urban form produced specific recommendations for how to design the new innovation district. The final recommendations were tailored to the site, based on the total land availability, building layout, and industry mix.
Each program sheet below details how the recommended lists of researchers, departments, startups, and mature companies can be organized into industrially themed neighborhoods anchored by technology transfer centers. Each district neighborhood is sized according to the employment requirements and work activity needs.
NanoTech & Materials
Urban Technology
Robotics & Manufacturing
AgriTech & Food Science
AI & Data Science
Section 07
The Final Innovation District Design
The final innovation district design, derived from the analytical findings.
The site is broken down into five innovation zones. Each program sheet from the innovation pipeline maps to the buildings within the district and contains: the research departments that generate the core knowledge, the technology transfer programs that bridge research to market, the innovation centers that incubate early-stage ventures, and the mature companies and support services that anchor the zone and attract talent.
Five Innovation Clusters
From the economic and research analyses, we identified five industry clusters that are close to Barcelona's existing economy, aligned with the city's strongest research departments, and complex enough to generate long-term economic growth:
- NanoTech & Materials: anchored by materials science research at Elisava and BarcelonaTech; targets advanced materials startups and the aerospace and automotive supply chain.
- Urban Technology: anchored by BarcelonaTech's urban engineering and smart city programs; targets companies working at the intersection of digital infrastructure, mobility, and city operations.
- Robotics & Manufacturing: anchored by BarcelonaTech's engineering departments; targets precision manufacturing and industrial automation companies already active in the Catalan economy.
- AgriTech & Food Science: anchored by UVic's Agri-Food and Nutrition research; targets the Catalan food industry's transition toward precision agriculture and sustainable production.
- AI & Data Science: anchored by UPF's Information Technologies and UOC's Computer Science departments; targets the city's growing base of data-intensive companies across finance, health, and logistics.
Each cluster program sheet maps research fields to innovation centers and to the related companies and support services. The sheets also show how each zone connects to its neighbors: which shared amenities, streets, and programs span cluster boundaries to create the cross-disciplinary encounters that productive innovation districts depend on.
Technology Transfer
NanoTech & Materials
Urban Technology
Robotics & Manufacturing
AgriTech & Food Science
AI & Data Science
The project delivered two main outputs. First, a recommendation of the most strategic industries to focus on, where to invest, and how to track progress over time. Second, a campus design for the new innovation district, designed to meet the needs of the target industries and companies and to create a district environment structured to support target industries and attract new ventures. The district is sized to reach the 20,000 knowledge-worker threshold identified in the economic analysis as the minimum for a self-sustaining district.
Beyond the analysis, I led the team that delivered the project on time and within budget. I also ran the client meetings throughout the engagement and presented the findings and final design to key stakeholders.